If 2024 felt tight, you weren’t imagining it.
After years of steady wage growth across hospitality, last year marked the slowest increase we’ve seen since before the pandemic. The good news: 2025 shows signs of a rebound – though where you work matters more than ever.
Here’s what the numbers say – and what they mean for your next move.
2024: The Slowdown Year
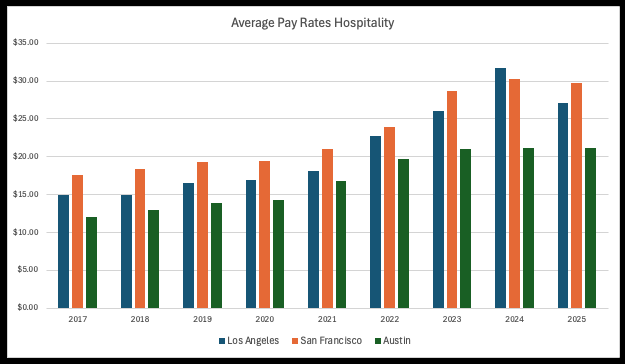
From 2017 through 2023, average hourly pay for hospitality jobs rose consistently – typically increasing anywhere from $0.75 to more than $3 per year. Then came 2024. Average hourly offers still increased, but only by $0.52 – roughly 30% lower than any other year’s increase in that period.
At the same time, everyday costs continued climbing. That means even though wages technically went up, real buying power barely moved.
If your paycheck felt stuck while rent, groceries, and gas kept rising – that wasn’t your imagination.
2025: Growth Returns (Mostly)
In 2025, the average hourly rate rose another $0.83 compared to 2024.
That’s not explosive growth, but it’s a meaningful improvement and a sign that many markets are back to competing for workers.
However, not every city followed the trend. Notable exceptions:
- Los Angeles – average hourly offers declined
- San Francisco – also saw a drop
- Austin – flat year, no meaningful growth
For Los Angeles and San Francisco, this marks the first decline in nine years.
Pacific Northwest: A Mix of Strong and Small Growth
The Pacific Northwest saw some of the strongest movement in 2025.
- Seattle: +5.7% to $26.05
- Portland: +$0.56 to $21.11
Seattle’s jump may be tied to restaurants hiring ahead of newly implemented minimum wage increases.
Portland’s growth was far smaller, but still positive in a year when some major markets stalled or declined.
Where Pay Is Growing Fastest
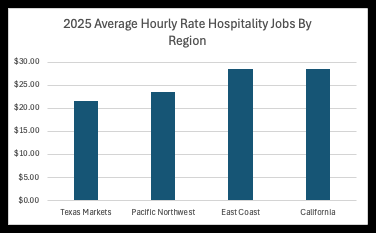
One of the biggest trends in 2025: Southern and lower-cost markets are seeing stronger increases. Average hourly growth by region:
- Texas (Austin, Dallas, Houston): +$1.20 average increase (~6%)
- Pacific Northwest (Seattle, Portland): +$0.98 (~4.5%)
- East Coast (NYC, DC, Philadelphia): ~+$0.75 (~2.3%)
- California: flat or declining in major markets
When wages start leveling off in high-cost coastal cities, growth often shifts to markets where restaurants still need to compete for talent. You can see that reflected in how the markets compare to each other – even though the big growth is in Texas, it’s still got a ways to catch up to its other cohorts:
Highest-Paying Cities in 2025
Here’s how major markets compare:
| City | Average Hourly |
| New York | $29.85 |
| San Francisco | $29.75 |
| Washington DC | $27.19 |
| Los Angeles | $27.11 |
| Seattle | $26.05 |
| U.S. Average | $23.38 |
| Dallas | $23.35 |
| Austin | $21.18 |
| Portland | $21.11 |
| Houston | $20.09 |
New York and San Francisco still lead the country, with DC and Seattle close behind. Boston, Chicago all come in around this $27.50, while Philadelphia still lags behind its other major metros, landing closer to Dallas which both peaked last year around $24.
But raw pay isn’t the whole story.
The Real Question: Where Does Your Pay Go Further?
High hourly rates don’t always have the same impact from place to place. What we wanted to know was; how much more should San Francisco’s hourly pay be above Seattle’s to offset the cost of rent? It was an interesting question that took some fiddling. Using the BEA’s Regional Price Parities (RPP) we can take what we know about hospitality pay rate offers from 2025 and get a resorted list.
When you factor in housing and cost of living:
- New York–Newark–Jersey City: $26.54 actual RPP adjusted
- Chicago–Naperville–Elgin: $25.95 actual RPP adjusted
- San Francisco–Oakland–Hayward: $25.16 actual RPP adjusted
- WashingtonDC–Arlington–Alexandria: $25.03 actual RPP adjusted
- Boston–Cambridge–Newton: $24.63 actual RPP adjusted
- Los Angeles–Long Beach–Anaheim: $23.48 actual RPP adjusted
- Philadelphia–Camden–Wilmington: $23.40 actual RPP adjusted
- U.S. average (Total): $23.38 actual RPP adjusted
- Seattle–Tacoma–Bellevue: $23.05 actual
- Dallas–Fort Worth–Arlington: $22.61 actual RPP adjusted
- Austin–Round Rock: $21.70 actual RPP adjusted
- Houston–The Woodlands–Sugar Land: $20.05 actual RPP adjusted
- Portland–Vancouver–Hillsboro: $19.80 actual RPP adjusted
For many workers, total affordability – not just hourly rate – determines whether a move makes sense. Making $1.11 more in Portland still doesn’t offset the lower cost of living in Houston. Chicago jumps 4 spots up with a lower cost of living to pay rate, putting its average above Boston, DC and LA. Conversely, a $2 lead in Seattle is crushed by its high cost of living compared to places like Philadelphia, which at $24.23 per hour average ends up higher than Seattle when adjusted.
What This Means for Job Seekers
1) The market is competitive again.
If you haven’t looked at your options recently, it may be worth checking what employers are offering.
2) Location matters more than ever.
Some cities are growing fast. Others are stalled or pulling back. We’ll be looking at delivering job trends in certain markets if you’re interested!
3) The biggest raises may come from switching jobs.
When annual growth slows, mobility becomes the fastest way to increase your pay.
4) Watch the regional trends.
Growth is shifting toward lower-cost markets where restaurants still need workers… that may mean widening your search to other parts of the country!
Bottom Line
If your paycheck felt stretched in 2024, you weren’t alone – wage growth slowed while everyday costs kept climbing.
The good news: 2025 is showing stronger wage growth in many markets. But the increases aren’t happening everywhere, and they’re not happening equally across employers.
If you’re feeling the pinch, one of the most proactive things you can do is keep an eye on what similar roles are paying in your area. Sometimes the fastest path to a higher wage isn’t waiting for a raise – it’s knowing your market value and being willing to explore new opportunities.
We embedded the full data here, some years are omitted due to several factors – employers have an opportunity to offer salary or hourly wages, salaries are omitted – some employees choose to inflate their pay rates in an effort to get seen in more searches, we omit illegitimate offers – some markets did not meet the threshold of data in a given year.
